Topics Covered
- Lot Cost Tab
- End of Period Reconciliation Reports
- Audit Trail Reports
- Profitability Report
- Multi-winery (Global) Reports
- FAQ
Lot Cost Tab
The cost summary and history for any single lot is available on the Cost tab of each lot and can be accessed directly from the Lot Cost Report or by clicking into the lot from the Lot Explorer.
Permissions: This tab is only visible to users whose cost permissions are set to "Full Access" or "Read Only."
On the Lot Cost tab you'll find a summary of work-in-progress (WIP) costs at the top, as well as a snapshot of finished goods cost captured at bottling, if applicable. There will be a finished goods summary for each Bottle action recorded. 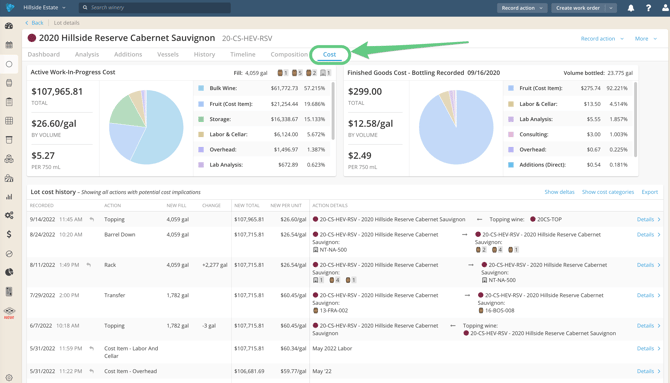
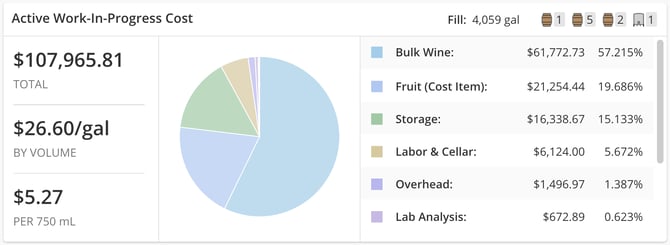
The Active Work-In-Progress Cost summary includes: Current total cost, cost per unit, and cost per bottle, as well as a breakdown of the total cost across assigned categories.
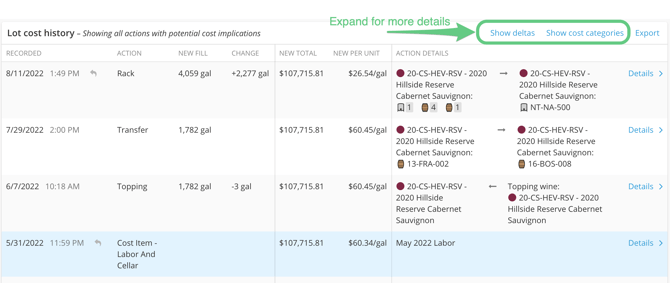
The Lot Cost History provides a list of all actions with potential cost implications to the cost/unit or total cost. This includes cost changes automatically distributed by InnoVint at each wine movement, and Cost Items applied by the winery. Click on each line to open a separate tab with the action details. Click on "show deltas" and "show cost categories" at the top to expand the table and gain further insight into how the values carried through each action.
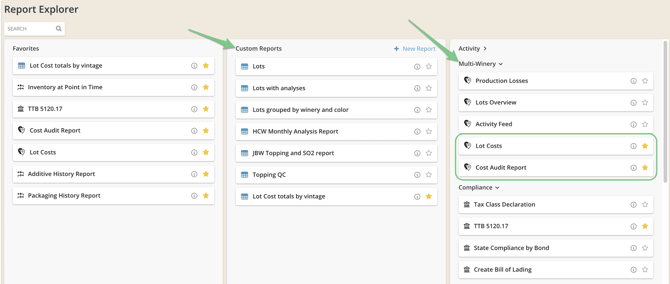
To report on many lots at once, access your Cost Reports from the COGS Tracking Explorer
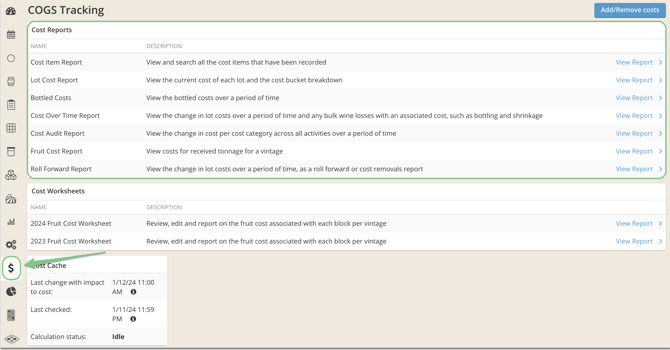
While the COGS Tracking Explorer holds most of the costing reports, in the main Report Explorer, you can also find our multi-winery costing report exports. This is also where you will find Custom Reports, which include many available columns of COGS related data for you to make your own!
End of Period Reconciliation Reports
Roll Forward Report
to confirm cost changes into and out of the system
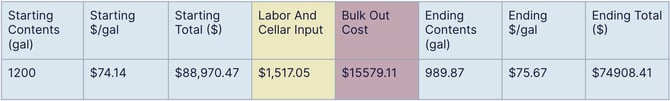
The Roll Forward Report is a csv export that details the costs that were entered and removed during a reporting period. This report is intended to include all initial indirect and direct cost inputs that occurred in the period. There is an input column for each cost category that received costs during the chosen period, and output columns for costs removed from the winery. "Inputs" consist of new costs added in the period, such as overhead cost items, or direct fruit cost processed into a lot code.
Note! These input columns do not include or represent cost shifts or distributions which occur via blending or transferring of contents and costs into new lots via wine movements. Please note that "removed" cost columns also do not include costs distributed from one lot to another via movement actions, such as blending. This is because these costs are not removed from the winery, but are instead shifted to other lots and as such will be included in updated ending lot costs.
- To identify how much was entered in a given period per cost category, sum each column containing "Input" in the column title (starting from Column F over).
Note: Inputs are reflective of any costs removed using an Add/Remove cost action. - To identify how much was removed in a given period, sum the columns titled Bottled Vol Cost, Bulk Out Cost, and Shrinkage Cost.
- This report contains all lots that had cost or contents at the start or end of the period should be included, regardless of activity occurring in that period, as well as lots that may have existed with cost or contents within the report duration
- To report on new cost inputs and removals, and to reconcile changed costs in & out of the system: Take the Starting Costs (Column E) + Input Costs (Column F over) - Removed Costs (Bottled, Bulk, Shrinkage)
Please note that this report is intended to reconcile bulk wine only, and does not include Case Goods lots.
Lot Cost Report
to understand the cost of each lot in inventory broken down by cost category as of now or a prior date
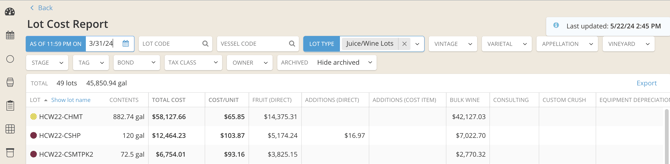
This report shows the total cost and the cost per volume unit, whether you are tracking in gallons or liters. It also breaks down the cost by cost category - based upon the categories that you use. If a row is selected, you will be navigated to the Lot Cost tab for that specific lot. The Cost over Time and Roll Forward reports' starting and ending lot contents/cost should balance back to this report.
The Lot Cost report may include Juice/Wine lots, Fruit lots and/or Case Good lots, but the Lot Type filter initially defaults to include only Juice/Wine lots. The report will include any lot with cost or contents at the selected point in time.
The report can be exported to csv at any time by clicking the 'Export' link in the upper right-hand corner of the report. Two export options are available:
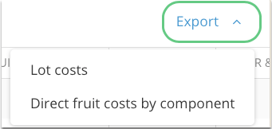
- The Lot Cost export automatically includes lots that had either cost or contents as of the requested point in time.
- Columns include the lot code and name, contents (in volume or weight), tax class, bond, total cost, cost per unit, cost category breakdown, lot Stage, vessels in the lot, owners (if applicable), lot tags, omposition (main vintage-varietal-appellation-vineyard-block), lot color, and intended use.
- The Direct fruit cost by component export gives you a point in time breakdown of which block components contributed to the overall direct fruit costs on your lot.
- This includes all components that carry direct fruit costs, and therefore this may not be an exhaustive list of all of the components within a lot (if some components did not carry direct cost) and will never display bulk components.
- Columns include: Lot Code, Lot Name, Vintage, Varietal, Appellation, Vineyard, Block, Clone, Grower, Fruit (Direct) ($), Tax Class, Bond, Stage, Owners (lot), Owners (vineyard), Tags (lot), Tags (vineyard), Tags (block), Color
NOTE: When reviewing a backdated Lot Cost Report, it will automatically include lots that had either cost or contents as of the requested point in time. Archived lots (that are archived NOW) will automatically be included if they had cost or contents at the requested point in time.
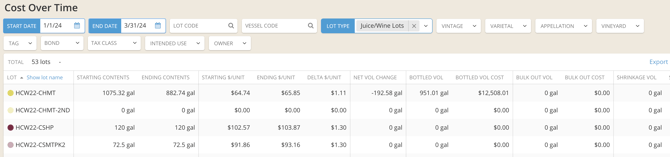
Cost Over Time Report
to see the change in lot cost and specific cost removals within a selected period
This report calculates what volumes and costs have left the system over a period of time. It displays the net change in lot cost, the net gain/loss of lot volume, and specifies the cost and volume of all bulk wine removed via bond transfer and bottling, as well as shrinkage that occurred. Shrinkage is specifically defined as volume lost for reasons outside of normal winemaking such as being destroyed or damage that needs to be written off (specifically, this requires the use of a volume adjustment action with the reason "Losses other than inventory").
The Cost Over Time report may include Juice/Wine lots, Fruit lots and/or Case Good lots, but the Lot Type filter defaults to include only Juice/Wine lots.
This report will automatically show archived lots if they were active and had volume at any point within the date range. If a row displays a 'Lot has never had contents or costs' message, it indicates that the lot has not been filled and no costs have been applied to it. If a lot is tracked in weight through the duration of the date range, the starting and ending contents will display as zero (0) until the lot is drained and pressed and tracked in volume.
The report displays on screen once the date criteria are set, and can be exported to csv at any time by clicking the 'Export' link in the upper right-hand corner of the report.
- The export includes: the Lot code, Lot name, starting and ending contents within the date range, starting and ending cost within the date range, starting and ending cost per unit, net volume change, Bottled, Bulk out and Shrinkage volumes and costs. The export also surfaces the lot composition (main vintage, variety and appellation) and lot tags, as well as Intended Use and Owners (if applicable).
Please note that if any costs have been removed via a "Remove cost" action, that a cost removal only updates the net ending cost for that period (there are no columns for cost categories to specify the removals).
Audit Trail Reports
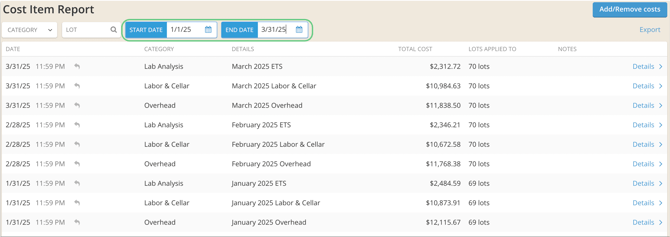
Cost Item Report
to confirm overheads were applied as desired.
This report acts as your chronological "Activity Feed" for Add/remove cost actions and displays cost actions recorded (added and removed), with the most recent at the top. You can search by lot code and cost category, and also filter by date to find entries for a specific cost period. If a row is selected, it'll take you to the cost item detail page, where the entry can be viewed in detail and edited if needed.
The report can be exported to csv at any time by clicking the 'Export' link in the upper right-hand corner of the report. The export includes the effective date, cost category, details, total cost, and involved lots.
Please note that this report cannot be filtered by owner or bond. If cost items have been added across many lots with multiple owners, any included lot owner will have access to view those cost items and any involved lots (but may not access lot details without appropriate owner permissions).
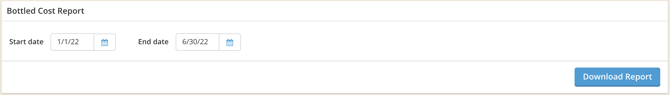
Bottled Costs Report
shows costs by category transitioned from bulk to bottled as of the point in time that wine is bottled
This report is run over a selected date range and is available to download as a csv file. It shows the total costs and breakdown of costs per category captured at the time of bottling. This is a snapshot of the costs removed from active WIP cost at the point when a Bottle action is recorded in InnoVint. These costs follow the removed volume to Case Good outputs as the finished goods costs.
The export includes the juice/wine lot details (lot code, name, owner and bond), date bottled, bottled volume, gains/losses, case good details (lot code, name and owner) bottled formats, notes (from the bottling action), total bottled cost, cost per bottle, and cost by category breakdown.
![]()
The Bottled Cost Report does not include costs added to the output case good lot after bottling has occurred, i.e. any direct packaging costs incurred via Add Packaging actions or cost items (such as mobile bottling run costs) applied to the case good lot. If cost is added to the case good lot after the bottling action, you can find the total case good lot cost on the Lot Cost Report (with cost category breakdowns).
Fruit Cost Report
to find fruit costs associated per weigh tag
The Fruit Cost Report is a csv export of direct fruit costs per weigh tag, downloaded by vintage. The export includes weigh tag number, date, weight, fruit lot code, bond, vintage, varietal, vineyard, block/clone, appellation, grower, weighing location, deputy weighmaster, direct fruit cost, tags for the lot/vineyard/block, and fruit lot owner tags.


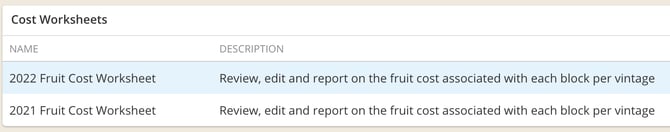
Fruit Cost Worksheet
track down assigned fruit cost per block
This report is an active worksheet and the functionality is detailed here. On the reporting side, it's valuable to compare previous vintage costs to current vintage costs. It's also useful for budgeting purposes since the system calculates the total expected cost per block based on the cost information.
This worksheet can be exported and further customized as needed - the export includes vineyard, block, previous vintage cost, current vintage cost, grower, varietal, clone, acreage, and vineyard and block tags.
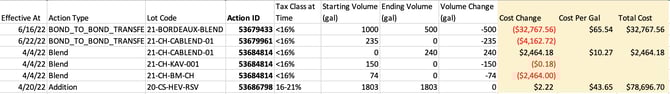
Cost Audit Report
provides details of all costing transaction activities, including movements that shift cost between lots
The Cost Audit Report provides a full activity history of lots in the winery, and includes every action that did or did not impact cost in a select date range, including cost items. Each line of the report correlates to a specific lot code involved in an action. Unique actions are identified by the action ID (column I). A single action may involve multiple lots, therefore it is common to see the action ID and other related details repeated on multiple lines of the Cost Audit Report.
Use the cost change column (column N) to see where lots have inherited or transferred cost. Scroll further right in the report to see that breakdown by cost category.
Recommended: Sort the report by action ID and highlight the cost change column to identify the total delta for the date range or the delta per action ID or action type.
The Cost Audit Report is generated as a csv download only. The export includes the effective at date and time, action type, lot code, lot name, bond, winery, action URL, action ID, tax class at time of action, starting volume, ending volume, volume change, cost change, cost per unit, total cost, and cost by category breakdown. On the far right of the report you will find columns for the lot owner, and lot tags.
Dry Goods Explorer
at a glance, see which packaging and dry goods have costs applied
Navigate to the Dry Goods Explorer using the packages icon on the left. Then select "Show costs" to reveal the Cost on Hand and Avg. Cost per Unit columns.


To drill down into packaging or additive costs have been utilized over a period of time, check out our Packaging and Additive History Reports via the main Report Explorer.
Profitability Report
The Profitability Report will automatically appear in the Costing section of InnoVint when the WinePulse integration is activated. Not a WinePulse client but interested in learning more? See our article on InnoVint + WinePulse Integration: Measuring Profitability! 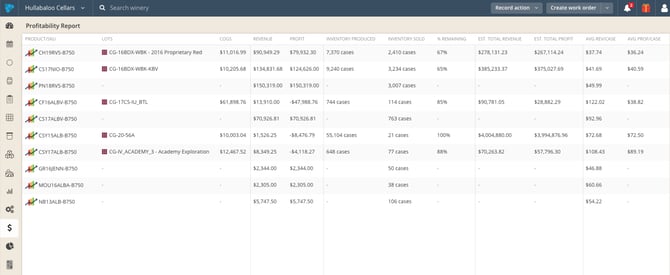
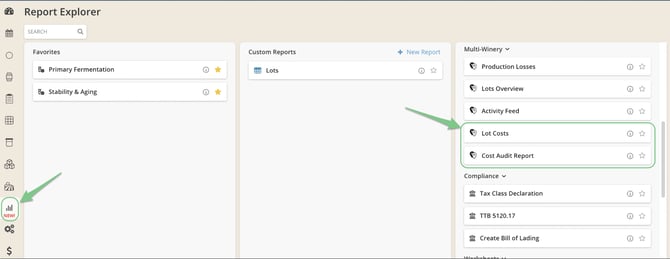
Multi-Winery (Global) Reports
Access Multi-Winery Cost Reports from the Reporting Explorer
Multi-Winery Lot Cost and Cost Audit Reports function exactly as the single-winery versions described earlier in this page, except for one primary difference. In the multi-winery reports, you can see data from any winery to which you have access and cost permissions enabled all in one report. From here, you can view and export the data together or filter by winery.
Custom Reports
We have cost data in our Custom Reports feature too! Easily group lots by type, color or variety and see the total dynamic costing summaries. Add or remove cost category columns that are meaningful to you. Check out more details on using Custom Reports for your costing needs HERE.

Additional Resources
- COGS Tracking in InnoVint (Overview)
- Learn how to allocate costs (direct, indirect)
- Onboard starting costs and update your Settings
- Interested in learning more? See how InnoVint distributes costs
FAQ
Q: How can I quickly pull reports per month, quarter or year?
A: The calendar icon is organized to help you easily pull up a month, quarter or year period, as shown below.
Q: How do I know if I have access to more than one winery in InnoVint?
A: If you click the winery name in the top left of your account and a dropdown opens with additional wineries, then you will have access to the wineries shown. 