This article covers how to use the Audit Report in InnoVint:
How to use the TTB Audit Report
InnoVint's TTB Audit Report is a csv file that provides a detailed list of each row and column of the TTB 5120.17 and the particular actions that contribute to the reported values for the selected bond within the date range. Each line represents a single lot's contribution to the values you see in the TTB 5120.17.
Sort or filter for a particular line of the TTB 5120.17
The highlighted columns below refer to the Part, Section, and Line of the TTB 5120.17.

For example, if you want to learn more about what actions contributed to Line 30. INVENTORY LOSSES of the TTB 5120.17, you can sort or filter for those columns of the Audit Report to narrow the field to Part 1, Section A, Line 30.
Search by action or type
The highlighted columns below represent action-specific details. These include the Effective at date and time, the action type, the URL to the action, and action ID. Each action or task recorded in InnoVint has a unique action ID.
A single action may involve multiple lots, therefore it is common to see the action ID and other related details repeated on multiple lines of the Audit Report.

To find a specific action, you can filter or sort the Audit Report for the particular action ID to find all the involved lots and values. Use the URL to view the action in InnoVint.
Understanding lot involvement
The columns on the far right of the report show you the involved lot code and the volume total it has contributed to the particular column of the TTB 5120.17. For example, column (a) of the TTB 5120.17 represents volumes in tax class <16%, while column (b) represents volumes in tax class 16-21%.
A negative value represents the volume that was removed from the lot, while a positive value represents the volume that was added. The sum of the values for all involved lots should equal the total net volume change of the action.

In the example below, action ID 67327537 is a Filter action. The Audit Report shows that the action removed 605 gallons from lot code 18-CS-BN2 (shown in line 5), and then added 559 gallons to lot code 18-CS-RES (shown in line 4). See the pivot table example below which shows how those 2 values combine for a net loss of 46 gallons.

Please note that sweetening transactions, where you transfer volume from tax class "Concentrate" into a volume of declared wine ("<16%", "16-21%", etc), are omitted from this report. These volumes are reported on the TTB Report itself, but the transactions do not surface on the Audit Report. Please use the Winery Activity Feed export, and filter for actions that occur across those two tax classes (Column H) to audit this type of sweetening action.
Putting it all together!
Pivot tables are an easy way to view the net total for each involved action. If you notice a discrepancy in your TTB 5120.17 (eg an unusually high net gain or loss), you can quickly identify the offending action in a pivot table and review the action details in InnoVint.
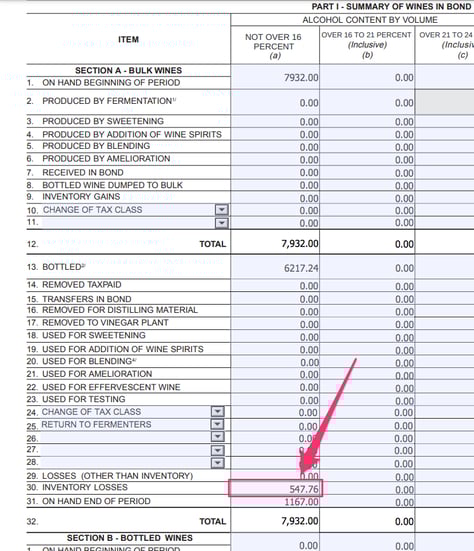
For example, we may be curious to find how InnoVint calculated 547.76 for the total value in:
- PART I - SUMMARY OF WINES IN BOND (GALLONS)
- SECTION A - BULK WINES
- LINE 30. INVENTORY LOSSES
- COLUMN (a) - NOT OVER 16 PERCENT
To find the contributing actions, we recommend the following steps:
Step 1: Download the Audit Report!
Step 2: Create a Pivot Table and set the filters, rows and values.
Step 3: Review the list of actions.
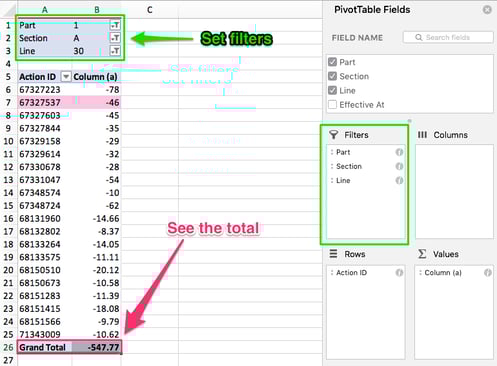
Notice in this example that the Part, Section, and Line filters are set at the very top to only show actions for Part 1, Section A, Line 30. The rows are set to show Action ID and the values field is showing entries for column (a).
In this view we can see the net volume change per action and also the total value. The total value in the pivot table matches the value we see in the TTB 5120.17 form. Because Line 30 is related to Inventory Losses, it makes sense that all the values are negative! Also note action ID 67327537 (highlighted in pink) - this is the net change value from the Filter action example above.
For more information on how InnoVint calculates values for the TTB 5120.17, check out our help center article: How InnoVint populates the TTB Report