Users can graph a single analysis from the Analysis tab on the Lot Details Page. Users will also be taken to the graphing page if a single analysis reading is clicked on from the Analysis bar on the Dashboard.
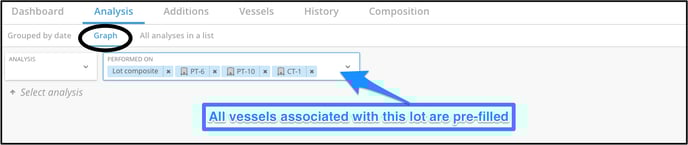
The page defaults to graph all vessels with the selected analysis recorded to them. If you only want to graph a select few of the vessels, you can take any off the list by clicking the x next to their name.
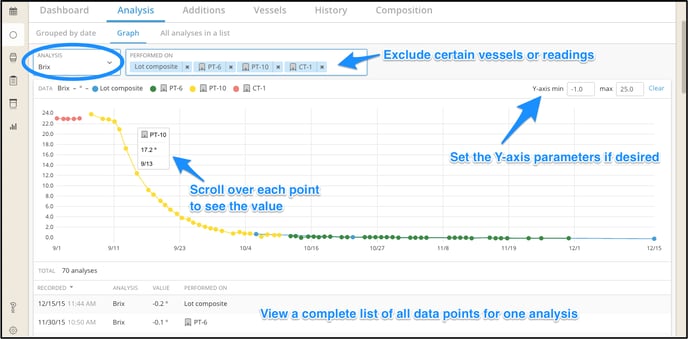
Select one analysis from the dropdown list to graph. Only analyses that have values input already will show in this list.
Scroll over any data point on the graph to see the value, date recorded, and the vessel it was recoded on or if it was a lot composite reading.
The Y-axis can be reset at any time to be smaller or larger by entering values in the min and max boxes.
All recorded values included in the graph are listed under the graph for easy viewing.